Performance and monitoring
Once you have your OMERO server running and secured, a second critical step will be tuning various configuration parameters in order to get optimal performance. Assorted timeouts can be found under Performance but the more critical properties are outlined below.
Database configuration
The configuration properties starting with
omero.db control how OMERO manages JDBC
connections to your database. For a production system,
omero.db.poolsize is the most important property to
modify. By default, a limited number of simultaneous connections
(e.g. 10) are allowed. You should plan for allowing a few connections
per concurrent user.
$ bin/omero config set omero.db.poolsize 100
Memory configuration
OMERO should automatically configure itself to take advantage of the physical memory installed on a system whilst leaving room for other services. You may wish to override the defaults on a production server, for instance if your machine is solely dedicated to running OMERO you can increase the amount of memory that OMERO will use. You may also need to modify your settings if you are seeing out-of-memory errors when dealing with certain types of images.
A number of configuration properties starting with omero.jvmcfg control the calculation of how much memory to allocate to various OMERO services on startup, most importantly:
- blitz
- indexer
- pixeldata
Configuration properties
Configuration properties can either be applied to all three service
types at the same time by omitting the service type (e.g.
omero.jvmcfg.strategy) or to each individually by including it
(e.g. omero.jvmcfg.strategy.blitz).
For example, the default, PercentStrategy, is equivalent to making the call:
$ bin/omero config set omero.jvmcfg.strategy percent
This could be changed to use the ManualStrategy for all servers:
$ bin/omero config set omero.jvmcfg.strategy manual
Strategies
A couple of strategies are available for calculating the effective JVM settings from the provided configuration properties.
- PercentStrategy
- Default. Reads the percent configuration property which can also be
set globally or on a service-type basis. This percentage (0-100)
of the system memory is used for the process, subject to minimum
and maximum limits which can be changed.
omero.jvmcfg.system_memory,omero.jvmcfg.min_system_memory, andomero.jvmcfg.max_system_memoryare all used for defining the system memory seen. The default percentages are: blitz and pixeldata 15%, indexer 10%. Ifomero.jvmcfg.perm_genoromero.jvmcfg.heap_sizeare explicitly set, they will be used directly as with the ManualStrategy. - ManualStrategy
- Simply provides the values given as the JVM settings. If no value is set for a particular configuration property, then the default is used: heap_size=512m and perm_gen=128m These values are equivalent to the defaults in OMERO 5.0.2 and earlier.
Examples
$ bin/omero config set omero.jvmcfg.percent.blitz 50
would raise the blitz heap size to 50% of the system memory seen.
$ bin/omero config set omero.jvmcfg.system_memory 24000
would set the system memory seen to 24GB regardless of the actual amount of memory present in the system. The PercentageStrategy would use this as the basis for setting the Java heap sizes for all services.
$ bin/omero config set omero.jvmcfg.max_system_memory 64000
would raise the maximum system memory seen by an OMERO installation to 64000MB of system memory. Assuming there was at least 64000MB of memory installed blitz would default to using 9600MB.
$ bin/omero config set omero.jvmcfg.strategy.indexer manual
$ bin/omero config set omero.jvmcfg.heap_size.indexer 2000
would set the indexer heap size to 2000MB without modifying the settings for the other services.
Tips
View the memory settings that will apply to a newly started server.
$ bin/omero admin jvmcfg
After modifying any memory settings, be sure to restart your server.
$ bin/omero admin restart
See also
- https://www.openmicroscopy.org/community/viewtopic.php?f=4&t=7400
- Forum thread on PixelData JVM memory settings
- Grid configuration
- Section of the advanced server configuration documentation describing
etc/grid/templates.xml.
Monitoring
In addition to watching the OMERO log files, the JVM itself provides a number of tools that you can use to determine the health of your server. JVisualVM, for example, can be used to visualize the memory use of each JVM:
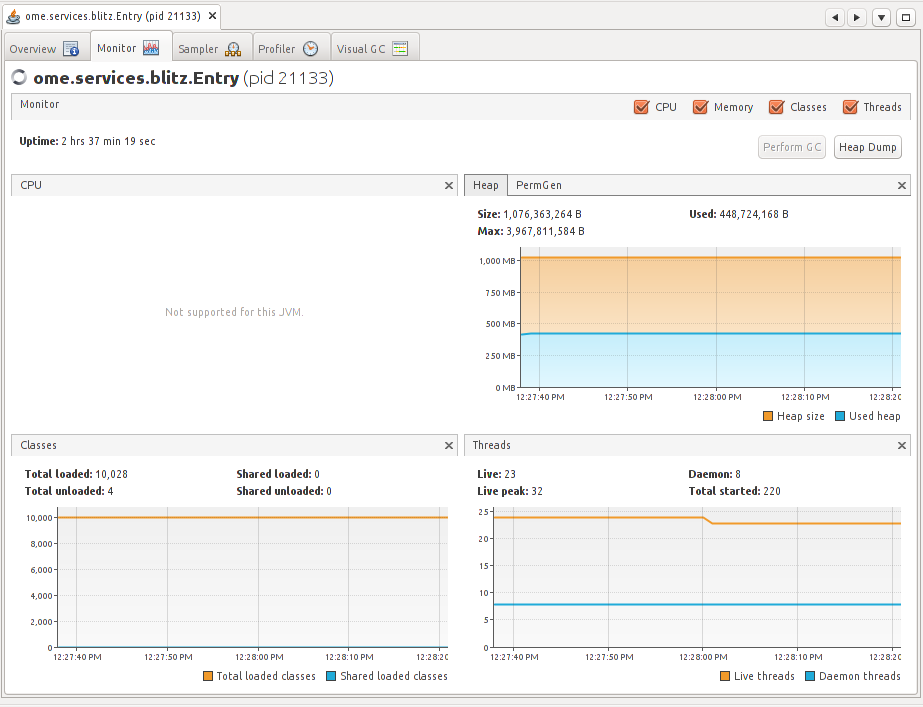
You will need to have the PID for the service you want to monitor, which will usually be the main Blitz process. You can find the PID either via omero admin diagnostics or alternatively via the jps command found in the JDK.
Another tool, JConsole, also provides access to the memory statistics for your JVM, but also lists the JMX management beans which provide extensive information about the running process. Information includes the number of queries that have been run, the number of open file handles, the system properties that were set on startup, and much more. Further, the ome.system.metrics package makes use of JMX to expose further properties.
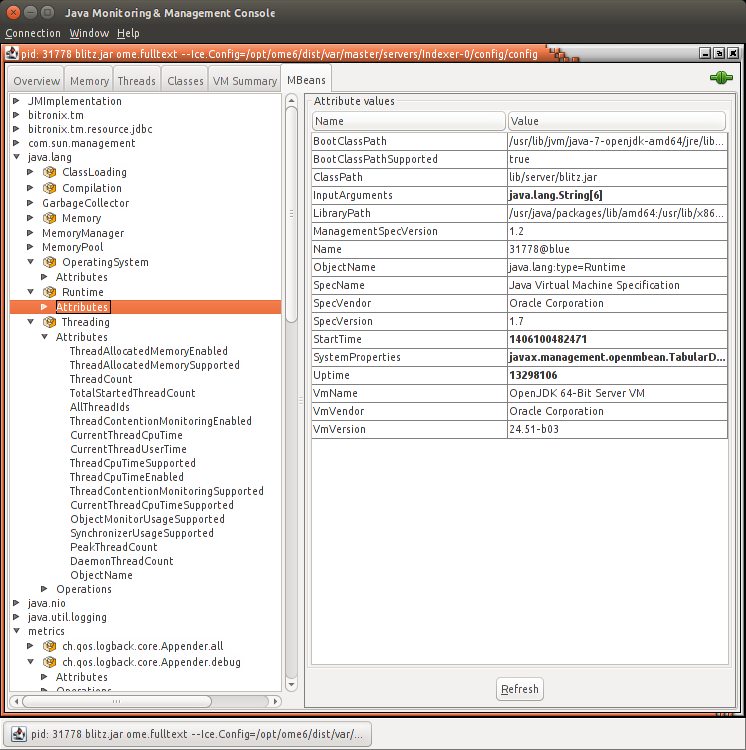
With further configuration, JMX properties can also be accessed remotely which can be very useful for monitoring your server with Check_MK, Nagios, Zenoss, or similar. However, care must be taken to protect the exposed ports.
Note
The commands above require the Java JDK as opposed to the JRE.
Metrics
Building on top of Coda Hale’s Metrics library, OMERO provides the ome.system.metrics package which measures a number of internal events and makes them available both via JMX as described under Monitoring but also prints them to the log files.
By default, these values are printed to each of the JVM-based log
files (e.g. var/log/Blitz-0.log, var/log/Indexer-0.log,
etc) once per hour. This value can be configured via
omero.metrics.slf4j_minutes. A typical value might look like:
11:28:18,923 INFO [ ome.system.metrics] (r-thread-1) type=TIMER, name=ome.services.fulltext.FullTextIndexer.batch ...
Values include basic statistics (count, min, max, mean, etc.) as well as 75th, 90th, 95th, etc percentiles. Further, the rate over the last minute, the last 5 minutes, and the last 15 minutes is provided (m1, m5, m15). For example:
- count=3601
- min=0.41…
- max=7.85…
- mean=0.94…
- stddev=0.31…
- median=0.96…
- p75=1.08…
- p95=1.25…
- p98=1.35…
- p99=1.43…
- p999=7.69…
- mean_rate=0.50…
- m1=0.49…
- m5=0.499…
- m15=0.49…
- rate_unit=events/second
- duration_unit=milliseconds
Useful metrics include:
- ch.qos.logback.core.Appender.error
- The number and rate of errors that have been logged. (All services)
- jvm.fileDescriptorCountRatio
- The ratio of used to available file descriptors. (All services)
- ome.services.eventlogs.EventLogQueue.priorityCount
- The number of items in the queue. (Indexer-only)
- ome.io.nio.PixelsService.minmaxTimes
- Time taken to generate min/max values per plane. (PixelData-only)
- ome.io.nio.PixelsService.tileTimes
- Time taken to generate tiled-pyramids for a big image. (PixelData-only)
